US iPhone App Spending Statistics - 2020 & 2021
iPhone App Spending Surges in the U.S.
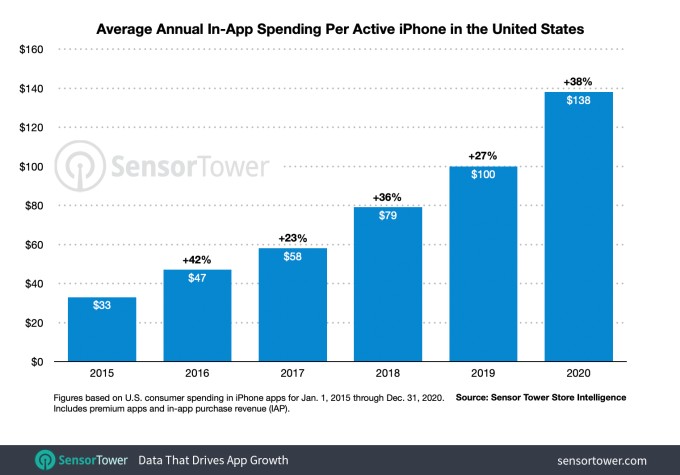
Last year, U.S. iPhone users averaged $138 in expenditures on applications, representing a substantial 38% increase compared to the previous year. This growth is largely attributed to the shifts in consumer behavior brought about by the pandemic, as reported by app store intelligence firm Sensor Tower.
Throughout 2020, individuals increasingly relied on iPhone apps for various activities, including work, education, entertainment, and shopping. This heightened usage resulted in record-breaking per-user spending and the most significant annual growth observed since 2016, when a 42% year-over-year increase was recorded.
Future Spending Projections
Sensor Tower anticipates this upward trend in consumer spending will persist into 2021. Projections indicate that average consumer expenditure per active iPhone in the U.S. will reach $180. This continued growth is expected to be influenced by the ongoing effects of the pandemic, particularly increased spending on mobile games.
 Global Trends and Category Breakdown
The rise in iPhone app spending within the U.S. mirrored a global phenomenon. Consumers worldwide spent a record $111 billion on both iOS and Android apps, according to Sensor Tower. App Annie’s analysis, which included third-party Android app stores in China, reported a total of $143 billion in spending.
In the U.S., the largest portion of iPhone consumer spending in 2020 was directed towards the gaming category.
Mobile Gaming Growth
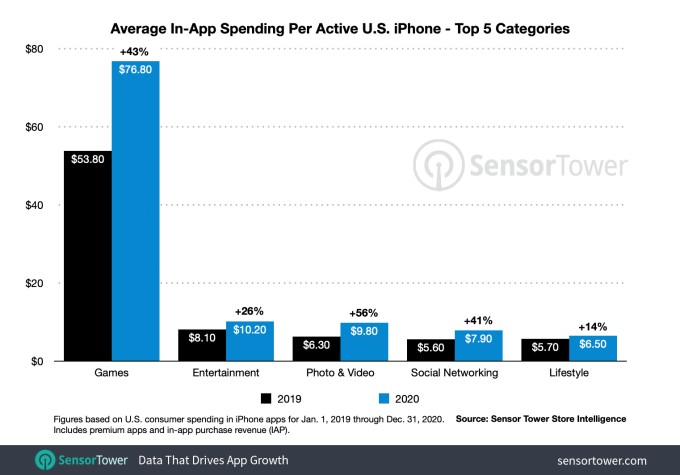
Per-device spending on mobile games experienced a 43% year-over-year increase, rising from $53.80 in 2019 to $76.80 in 2020. This represents a significant acceleration compared to the 22% growth observed between 2018 and 2019, when in-game spending increased from $44 to $53.80.
Puzzle games, such as Candy Crush Saga and Gardenscapes, were particularly popular, potentially offering a distraction from pandemic-related anxieties. This category averaged $15.50 per active iPhone. Casino games followed closely with an average of $13.10, benefiting from the closure of physical casinos.
Strategy games also witnessed a surge in spending, reaching an average of $12.30 per iPhone user.
 Entertainment and Other Categories
The Entertainment category also saw substantial growth in in-app spending. With traditional entertainment venues closed, consumers increasingly turned to streaming applications. The launches of Disney+ in late 2019 and HBO Max in May 2020 further fueled this trend.
Average per-device spending in the Entertainment category rose to $10.20, a 26% increase from the $8.10 spent in 2019. Prior to this, per-device spending had only grown by 1% between 2018 and 2019.
Other top-performing categories included:
- Photo & Video (up 56% to $9.80)
- Social Networking (up 41% to $7.90)
- Lifestyle (up 14% to $6.50)
Apps like TikTok, YouTube, and Twitch contributed to these increases. Twitch experienced a remarkable 680% year-over-year revenue growth on U.S. iPhones in 2020, while TikTok saw a 140% increase. Within the Lifestyle category, dating apps benefited from consumers seeking virtual connections during lockdowns.
The Unique Impact of 2020
The defining characteristic of 2020 wasn't necessarily *which* apps people used, but rather *how often* they were utilized and the amount of money spent within them.
App Annie previously noted that the pandemic accelerated mobile adoption by two to three years. Sensor Tower further indicates that the industry experienced a diminished seasonality in spending patterns, particularly within the gaming sector. Traditionally, certain times of the year see slower spending, but this was not the case in 2020, as any time proved to be conducive to app expenditures.
Related Posts

Peripheral Labs: Self-Driving Car Sensors Enhance Sports Fan Experience
YouTube Disputes Billboard Music Charts Data Usage
Oscars to Stream Exclusively on YouTube Starting in 2029

Warner Bros. Discovery Rejects Paramount Bid, Calls Offer 'Illusory'

WikiFlix: Netflix as it Might Have Been in 1923